2023 Pollen Season Recap
What's up, Forsyth??
Looking to learn more about our 2023 pollen season and pollen monitoring program in general? We have the blog for you!
The Forsyth County Office of Environmental Assistance and Protection (FCOEAP) has been monitoring local pollen concentrations for over 25 years (since 1997), with each pollen monitoring season typically beginning in early to mid-February and concluding around late October. For 2023, the last day FCOEAP counted pollen this year was on October 31st, prior to an influx of colder air that brought a widespread freeze to the Triad which effectively ended the growing season.
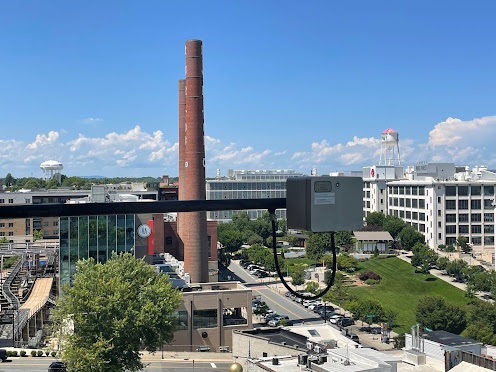
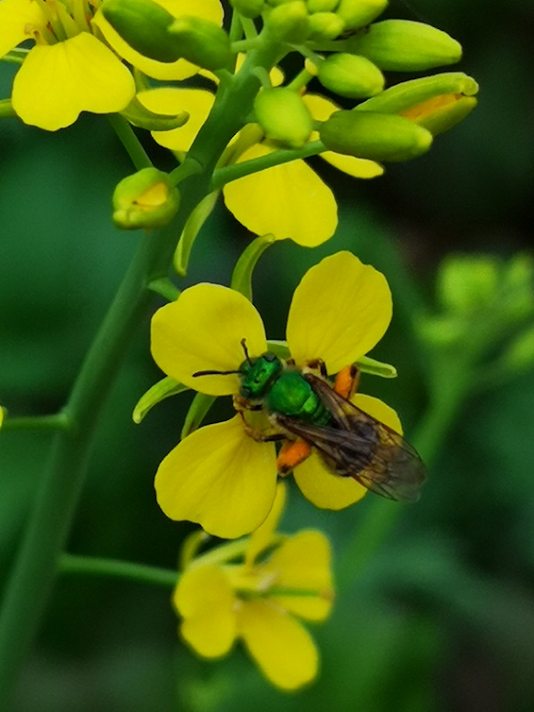
Our daily pollen samples are collected with a RotoRod Model 40 sampler (Figure 1), and then the samples are analyzed using a Leitz Wetzlar microscope (Figure 2). The area of the sample and the sampling time are fixed parameters, allowing us to calculate pollen concentrations based on the number of grains counted. These concentrations are calculated in grains per cubic meter and are then converted to our Pollen Rating scale, or PRS, which mimics Environmental Protection Agency's Air Quality Index (AQI).
Since trees and other plants don't have wrists or watches, the internal clocks of area plants are largely controlled by changes in day length and sun angle. The onset of pollination, however, can be altered by other stressors such as abnormal weather patterns. With the exception of most of 2020 and the early part of 2021 due to COVID-19, FCOEAP has data dating back to 1997. Since we only process pollen samples on non-holiday weekdays, weekends create regular gaps in the data. Over longer time frames, these data voids average out, but when comparing a single year to a longer time frame, some smoothing needs to be applied to make the graph legible. To compare apples to apples, a centered rolling 7-day average has been applied to the pollen data in the charts below (Figures 3-5).
Figure 3 compares tree pollen from this year to all available previous years. A pretty typical onset was observed this year. The dip observed in March is something that we see most years that gets averaged out over the long term due to changes in exactly when it occurs. Oak trees are responsible for our largest tree pollen numbers during April, but this year, the peak was lower than what we see on average. Tree pollen hung on in larger numbers than previous years through June and July before reaching a minimum in August.
Weed pollen also had a standard year overall. A couple things to note: 1) weed pollen concentrations were a bit lower than what we've seen over the long term in late spring and early to mid summer, and 2) similarly to the oak peak in the spring, the ragweed peak that we observed in late August and early September was much more muted than normal.
If you are interested in receiving our pollen reports via email, you can sign up here under the Reports by Email or FAX tab. Alternatively, you can receive our reports by following our social media accounts on Twitter or Facebook. Pollen monitoring will start up again sometime in February 2024.


Comments
Post a Comment